Guide
Status Dashboard
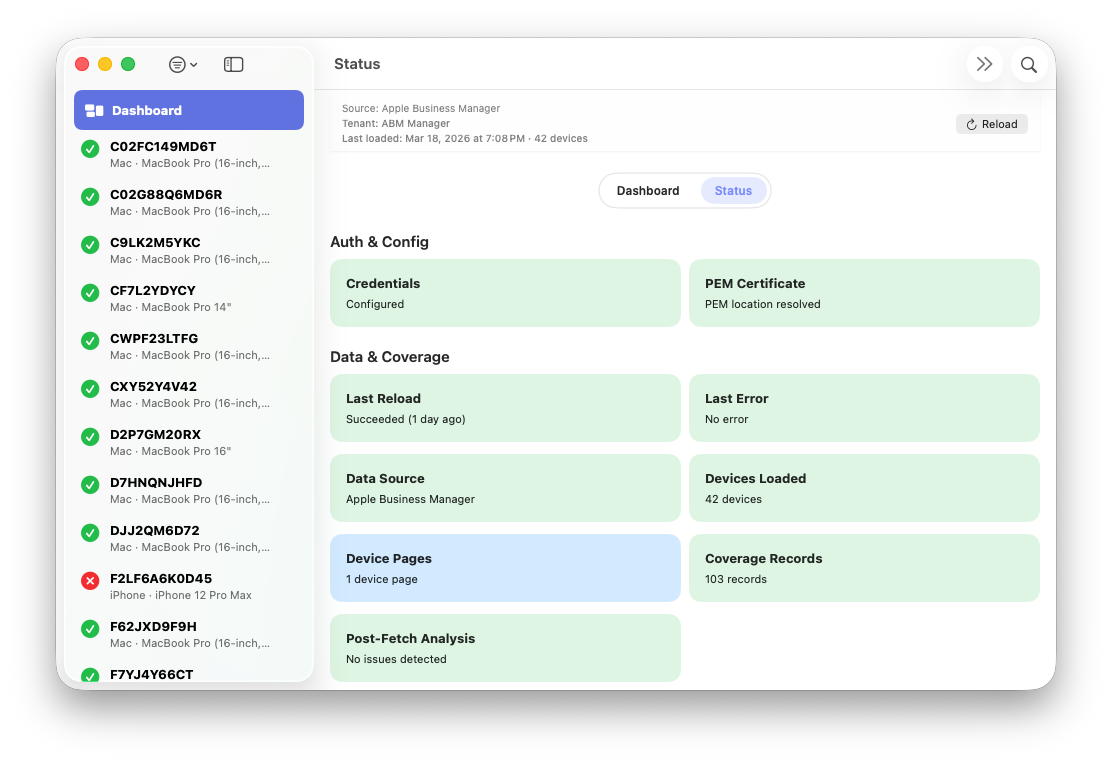
The Status Dashboard provides detailed health and diagnostic information for the currently active tenant. It is designed to give administrators clear visibility into credential configuration, recent import activity, and runtime telemetry without initiating any actions or modifying data.
The dashboard reflects the current state of:
- Credential presence and structural completeness
- PEM private key resolution and accessibility
- Whether the last import succeeded, failed, or is in progress
- The number of devices processed during the most recent import
- Whether sample data was used
Import and retry telemetry is summarized for transparency, including:
- Device-page retry counts
- Coverage retry counts
- Rate-limit (HTTP 429) events
- Server-side errors (HTTP 5xx)
- Cumulative backoff time applied during the last run
Timing information is also displayed, such as when the most recent reload started and finished. This information persists per tenant across app launches and allows administrators to quickly understand data freshness.
The Status Dashboard is strictly read-only. It does not initiate imports, retries, or credential changes. Its purpose is to surface the outcome and health of prior activity and to correlate visible issues with log entries.
All values shown in the Status Dashboard are tenant-scoped. When switching tenants, the dashboard updates immediately to reflect the health and history of the newly selected tenant.
For detailed event timelines and error messages, administrators can open the Log window, which provides tenant-aware log filtering and export capabilities.